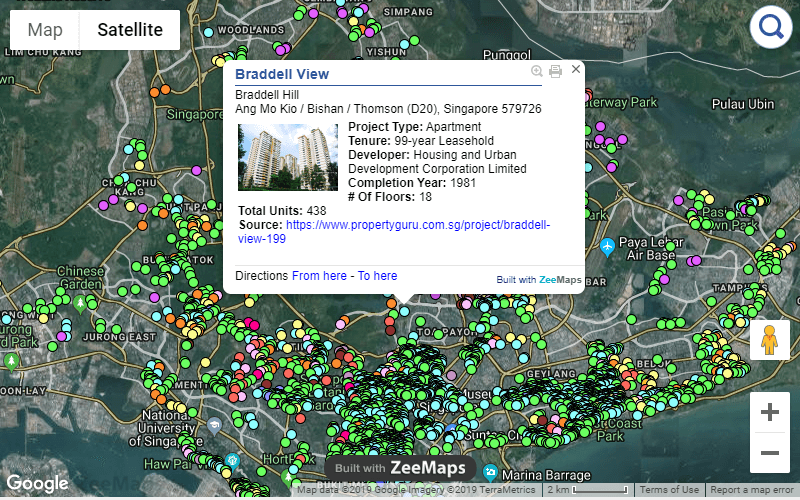
An interactive map “Made by Teoalida” with HDB blocks colored by year built, as alternative to official HDB Map Services. Blocks can recolored by year built.
As October 2025 the map contains 13010 residential buildings, with the following breakdown:
How to search / filter blocks on map
Click magnify button in top-left (next to Map / Satellite) and use GO TO box to navigate to a specific location, town, block number, street name or postal code. Click colored markers to view year built, number of floors, number of units, upgrading programmes, typical floor plans, chances to get SERS, etc. Use filters to show blocks by specific criteria: filter examples.
| Icon color . . | Pixels | RGB | demolished blocks | standing blocks |
|---|---|---|---|---|
| 242 | 25 | |||
| 11 | 255,64,64 | 32 | ||
| 11 | 255,64,64 | 122 | 163 | |
| 11 | 255,88,64 | 248 | 30 | |
| 12 | 255,112,64 | 146 | 890 | |
| 12 | 255.136.64 | 24 | 14 | |
| 12 | 255,160,64 | 51 | 20 | |
| 13 | 255,184,64 | 72 | 23 | |
| 13 | 255,208,64 | 3 | 81 | |
| 13 | 255,232,64 | 25 | 212 | |
| 14 | 255,255,64 | 100 | 547 | |
| 14 | 232,255,64 | 49 | 653 | |
| 14 | 208,255,64 | 64 | 1928 | |
| 15 | 184,255,64 | 55 | 1119 | |
| 15 | 160,255,64 | 33 | 568 | |
| 15 | 136,255,64 | 19 | 636 | |
| 16 | 112,255,64 | 27 | 1067 | |
| 16 | 88,255,64 | 8 | 562 | |
| 16 | 64,255,64 | 285 | ||
| 17 | 64,255,88 | 148 | ||
| 17 | 64,255,112 | 11 | 164 | |
| 17 | 64,255,136 | 105 | ||
| 18 | 64,255,160 | 2 | 108 | |
| 18 | 64,255,184 | 5 | 38 | |
| 18 | 64,255,208 | 35 | ||
| 19 | 64,255,232 | 16 | 372 | |
| 19 | 64,255,255 | 35 | ||
| 19 | 64,232,255 | 28 | ||
| 20 | 64,208,255 | 25 | ||
| 20 | 64,184,255 | 10 | ||
| 20 | 64,160,255 | 126 | ||
| 21 | 64,136,255 | 6 | ||
| 21 | 64,136,255 | 5 | ||
| 21 | 64,136,255 | 5 | ||
| 21 | 64,112,255 | 5 | ||
| 21 | 64,112,255 | 9 | ||
| 22 | 64,112,255 | 9 | ||
| 22 | 64,88,255 | |||
| 22 | 64,88,255 | 15 | ||
| 22 | 64,88,255 | |||
| 22 | 64,64,255 | 72 | ||
| 23 | 88,64,255 | 3 | ||
| 23 | 88,64,255 | 5 | ||
| 23 | 88,64,255 | 5 | ||
| 23 | 112,64,255 | |||
| 23 | 112,64,255 | |||
| 24 | 112,64,255 | |||
| 24 | 136,64,255 | 3 | ||
| 24 | 136,64,255 | 2 | ||
| 24 | 136,64,255 | |||
| 24 | 160,64,255 | 7 |
About me & history of HDB map
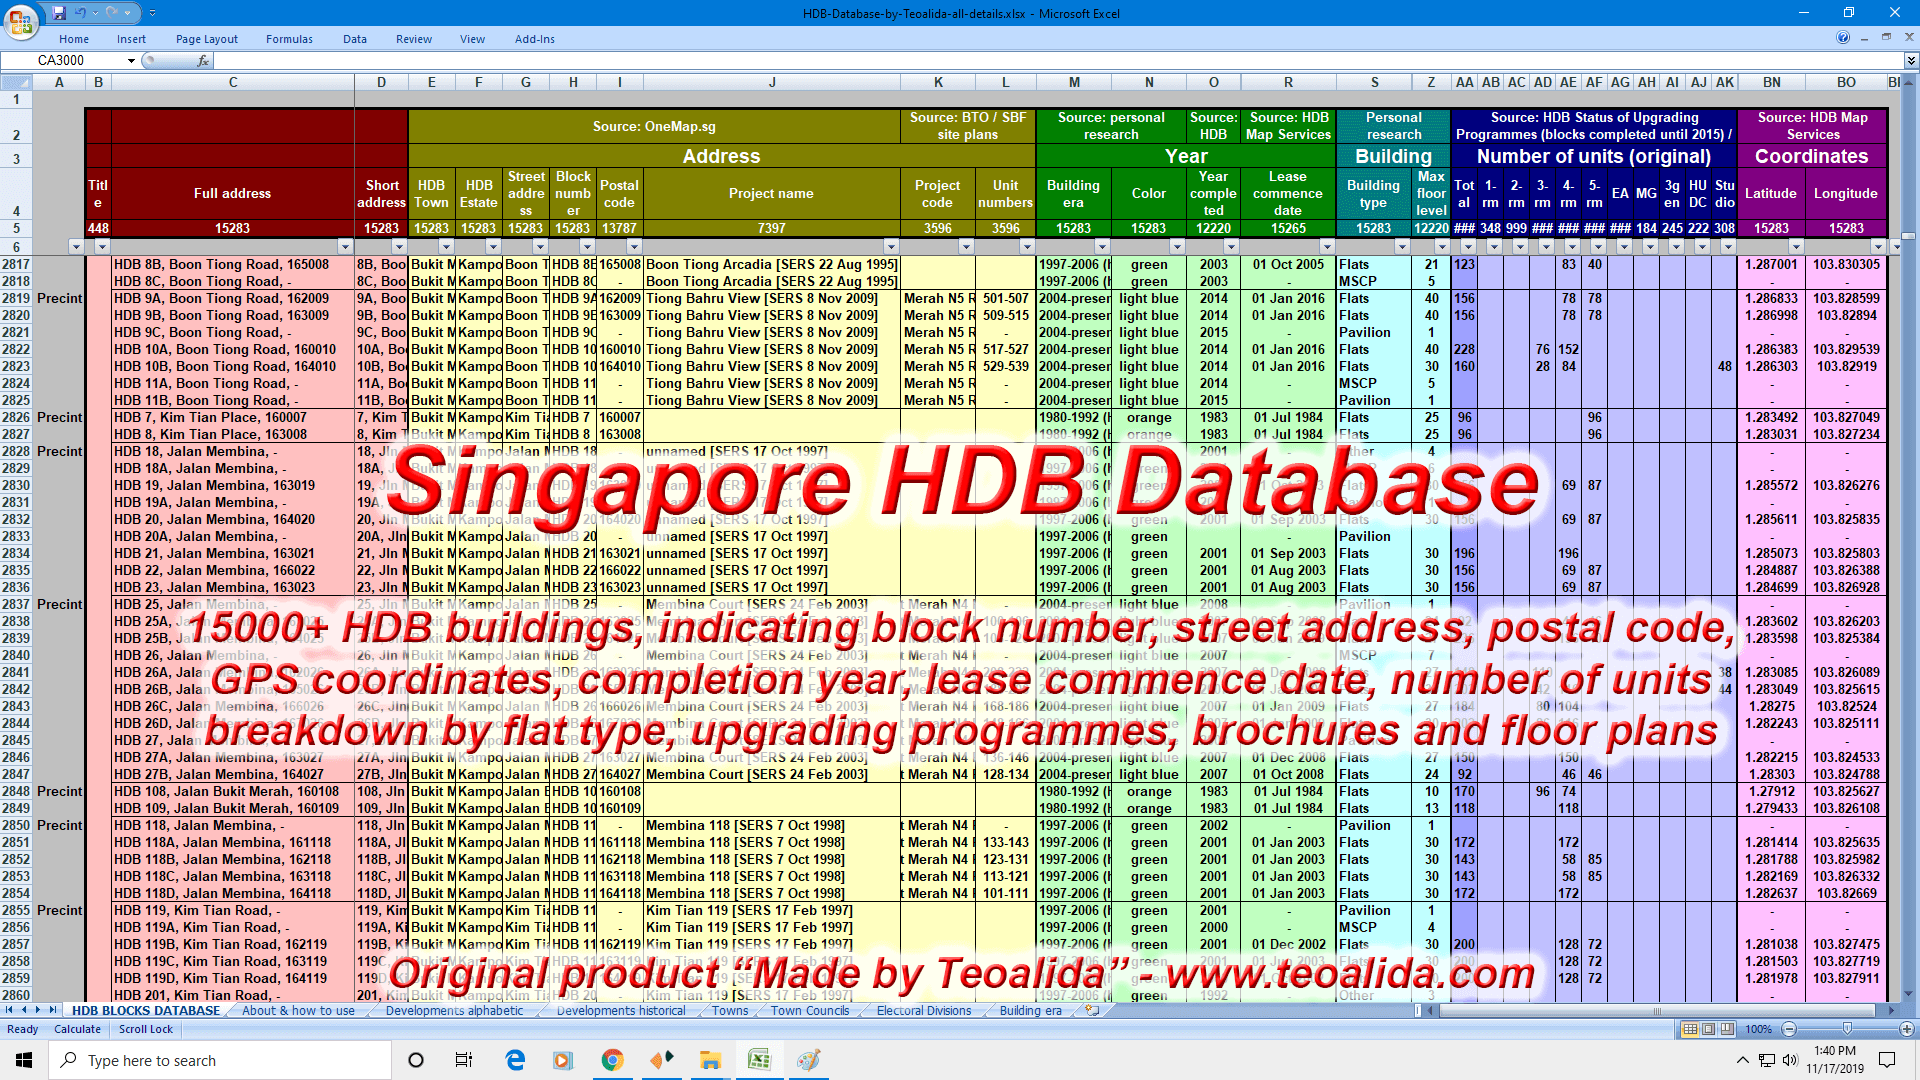 I have been collecting HDB data since 2009, making HDB Blocks Database in Excel, an original compilation “Made by Teoalida” which took over 500 hours of work. Collecting data from multiple sources, I manually entered data in one Excel table for all HDB blocks ever built in Singapore, indicating block number, street address, postal code, GPS coordinates, construction year, lease commence date, number of floors, number of units breakdown by flat type, upgrading programmes, brochures and floor plans. Since 2015 I sold Excel file to various companies.
I also collected over 1000 floor plans in PDF format from HDB’s Sale of Balance Flats. In 2009 I wrote HDB history & floor plans evolution 1930s-present which I updated in 2014 with new screenshots for ~70 floor plans that I though that are most common.
I wanted for long time to display data in an interactive map, but I did not had sufficient technical knowledge to do this. Thanks to Sik Shu Wei who contacted me in August 2017, I saw a colored map on his website, he told me that made map with Google Fusion Tables, a FREE experimental application that provided only 9 colors of colored dots, as well as other icons representing various businesses. Sik Shu Wei map was only displaying lease commence date and colored blocks accordingly, it was a MESS because lease commence date is provided by HDB only for blocks available on resale market, so rental blocks and recent blocks under construction or under MOP were in same color on his map.
I made my own interactive map in September 2017 importing my very detailed HDB Database into Google Fusion Tables. Google announced closure of Fusion Tables on 3 December 2019, so in October 2019 I moved to ZeeMaps, a paid service that provide 31 colors to choose from, and ability to filter and display only blocks of specific criteria. If anyone thinks that is better to use different colors that indicate block types and construction years, please tell.
In December 2022 I recreated maps in WP Go Maps (WordPress plugin) and deleted ZeeMaps.
In September 2024 I moved map to a custom-made software by ByteRemix.
Is there such thing as a HDB block that has 1 floor only? I couldn’t find it.
If you are referring at legend showing one 1-floor block standing, that was an error, an 11-storey block counted as 1-storey. But there have been 1-storey terraced houses built by SIT, now demolished (Bukit Panjang Estate, and maybe more)
Nice map
Super helpful guide—love how detailed and searchable the HDB map has become! The filters make it so easy to find exactly what you’re looking for. Amazing work over the years, truly a labor of love!